The New Data Explorer: Supplier Data You Can Actually Read
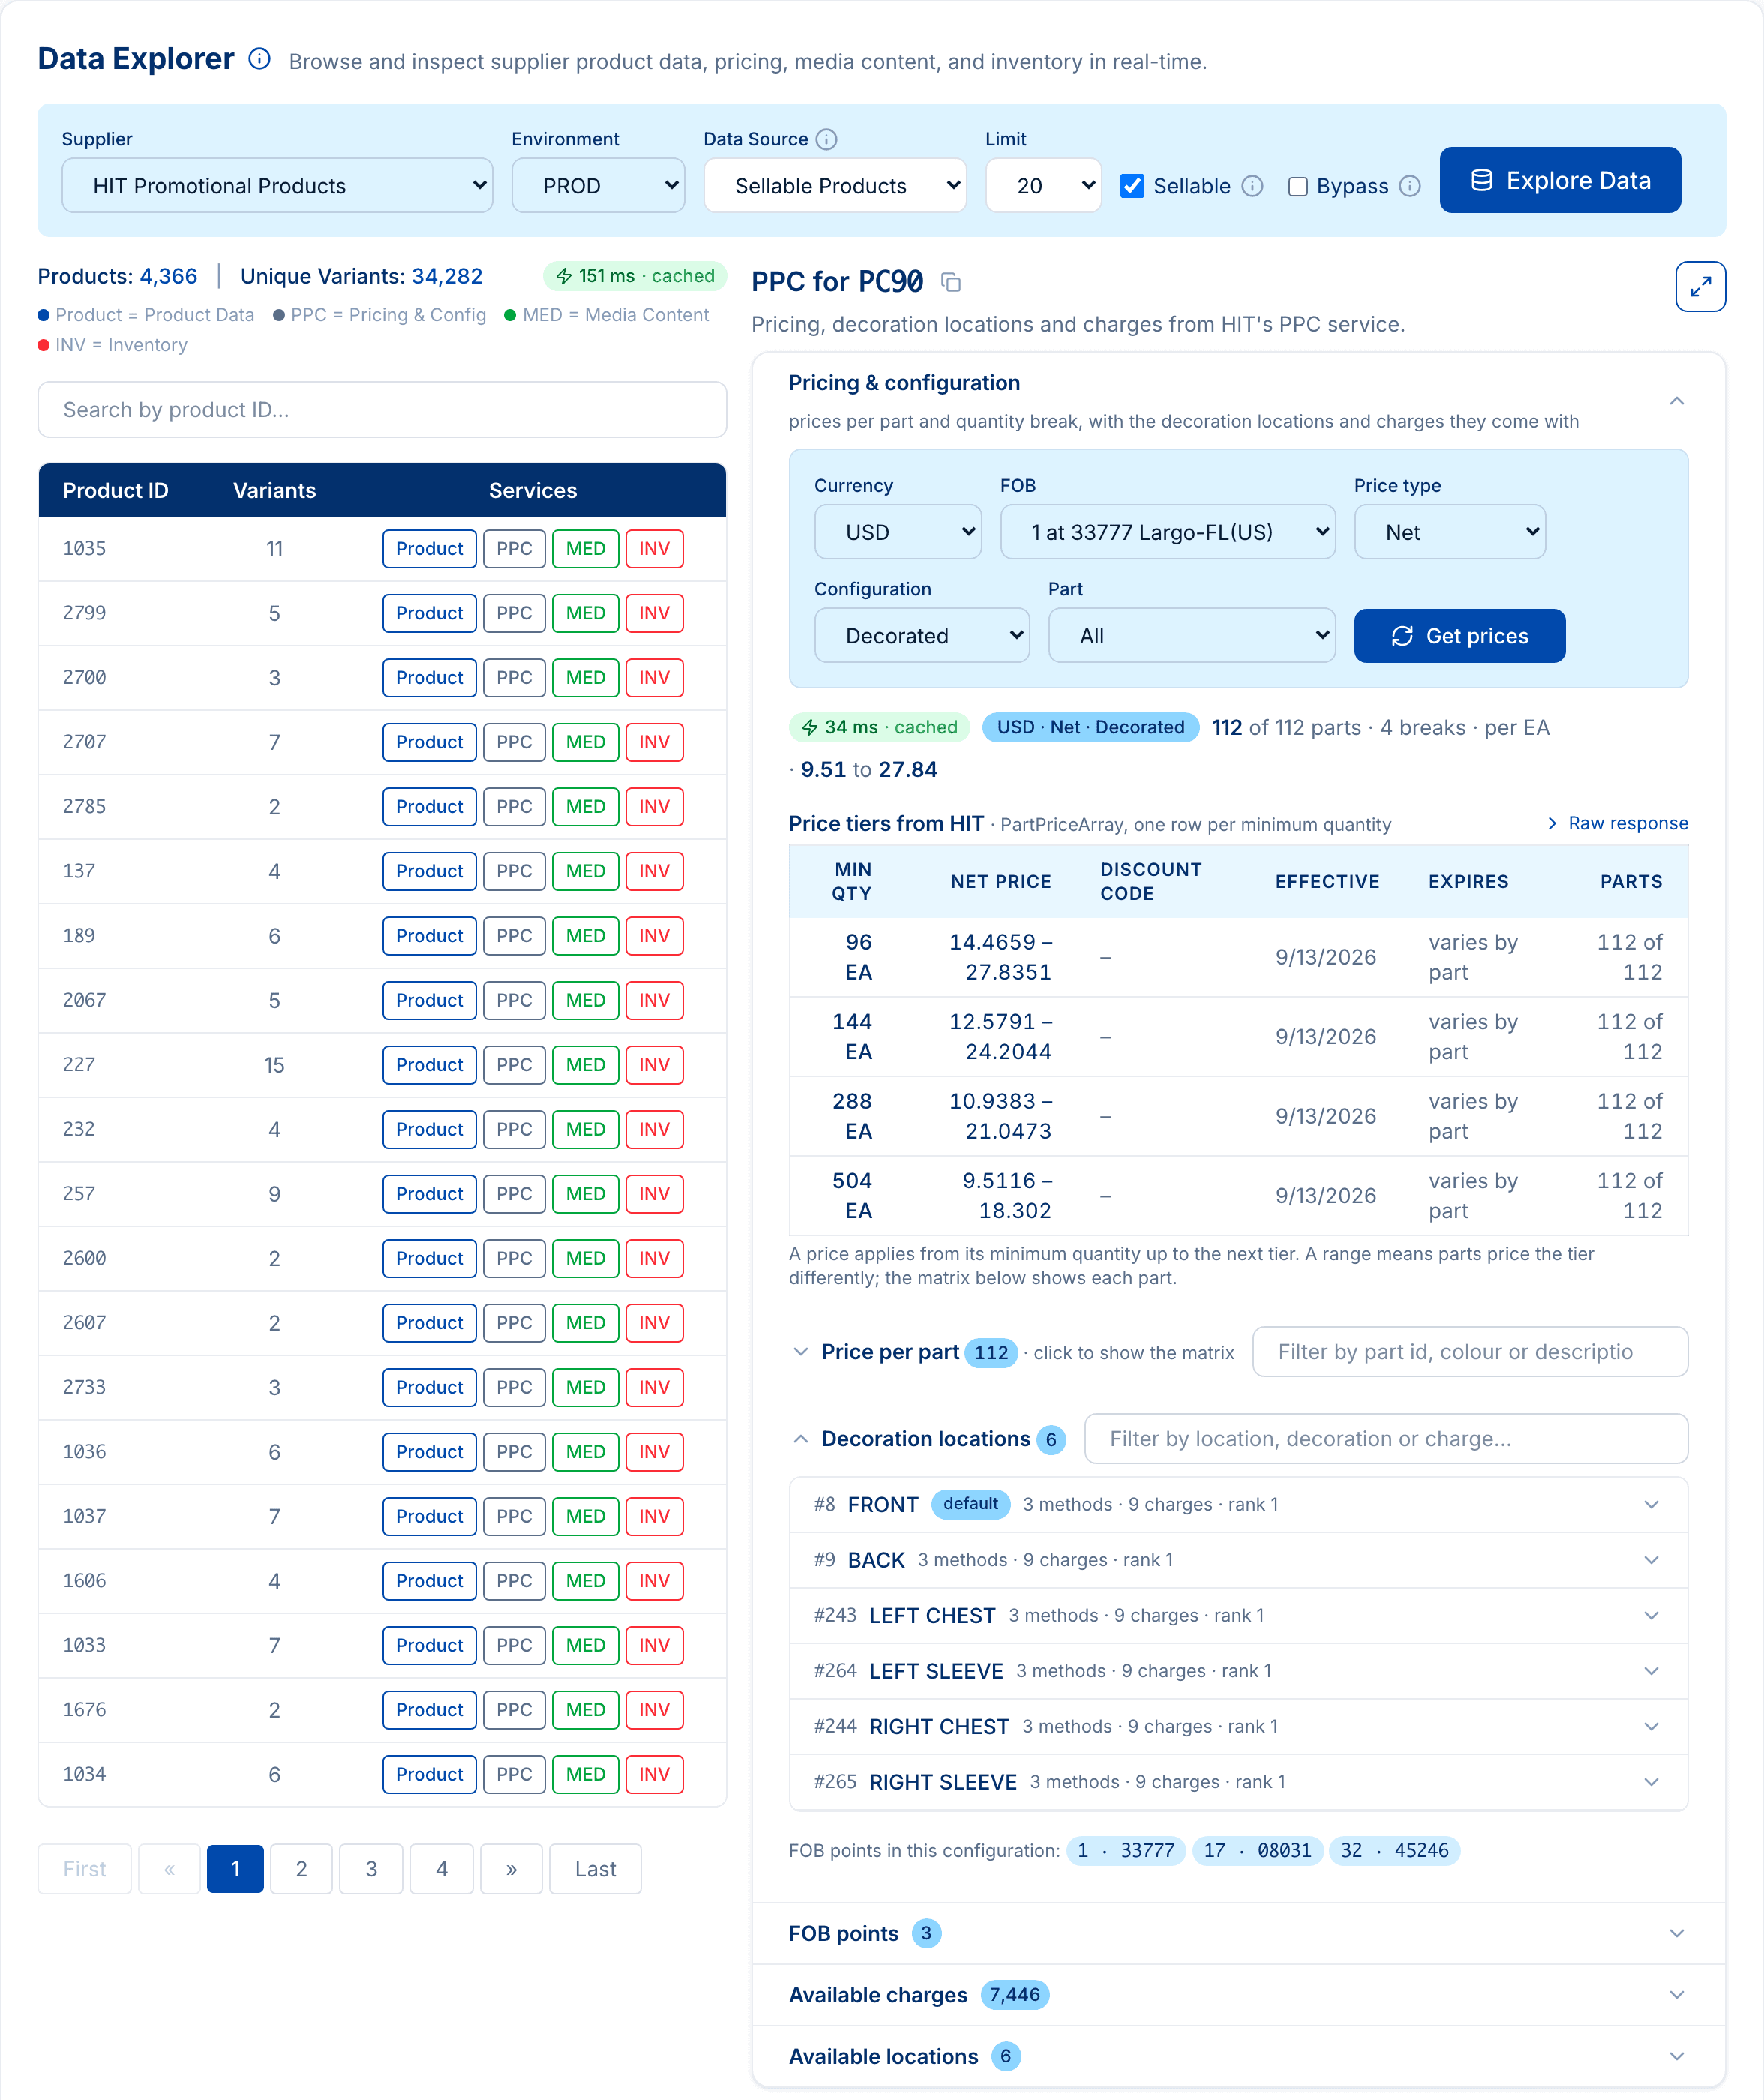
The Data Explorer is the part of the PSRESTful dashboard where you point at one supplier and one product and see exactly what their PromoStandards services return: product data, inventory, media and pricing, live. It is the tool we reach for first when a distributor asks “why does this product look wrong in my store?”, and it is the fastest way to check what a supplier actually publishes before you write a line of integration code.
It has also, for a long time, been a wall of raw fields. A 112-part sweatshirt was a 112-row list. Pricing was four sub-tabs, with the one that mattered hidden behind a submit button. Finding a decoration location on a supplier that lists forty of them meant scrolling.
This month we rebuilt it tab by tab. Here is what changed.
A cleaner, faster panel
Every tab now shares the same design: a sectioned card with a count pill on each section, a chevron to fold it, and a badge on every result that tells you two things you used to have to guess. How long the supplier took to answer, and whether the answer was live or served from the PSRESTful cache. A cached answer can be up to two hours old; tick Bypass in the toolbar and the same call goes to the supplier again.
The product list stays sticky on the left while the detail panel takes the full height of the page, and the expand button in the corner gives the detail the whole width when a matrix needs it. Everything works in dark mode.
Product parts as a colour by size matrix
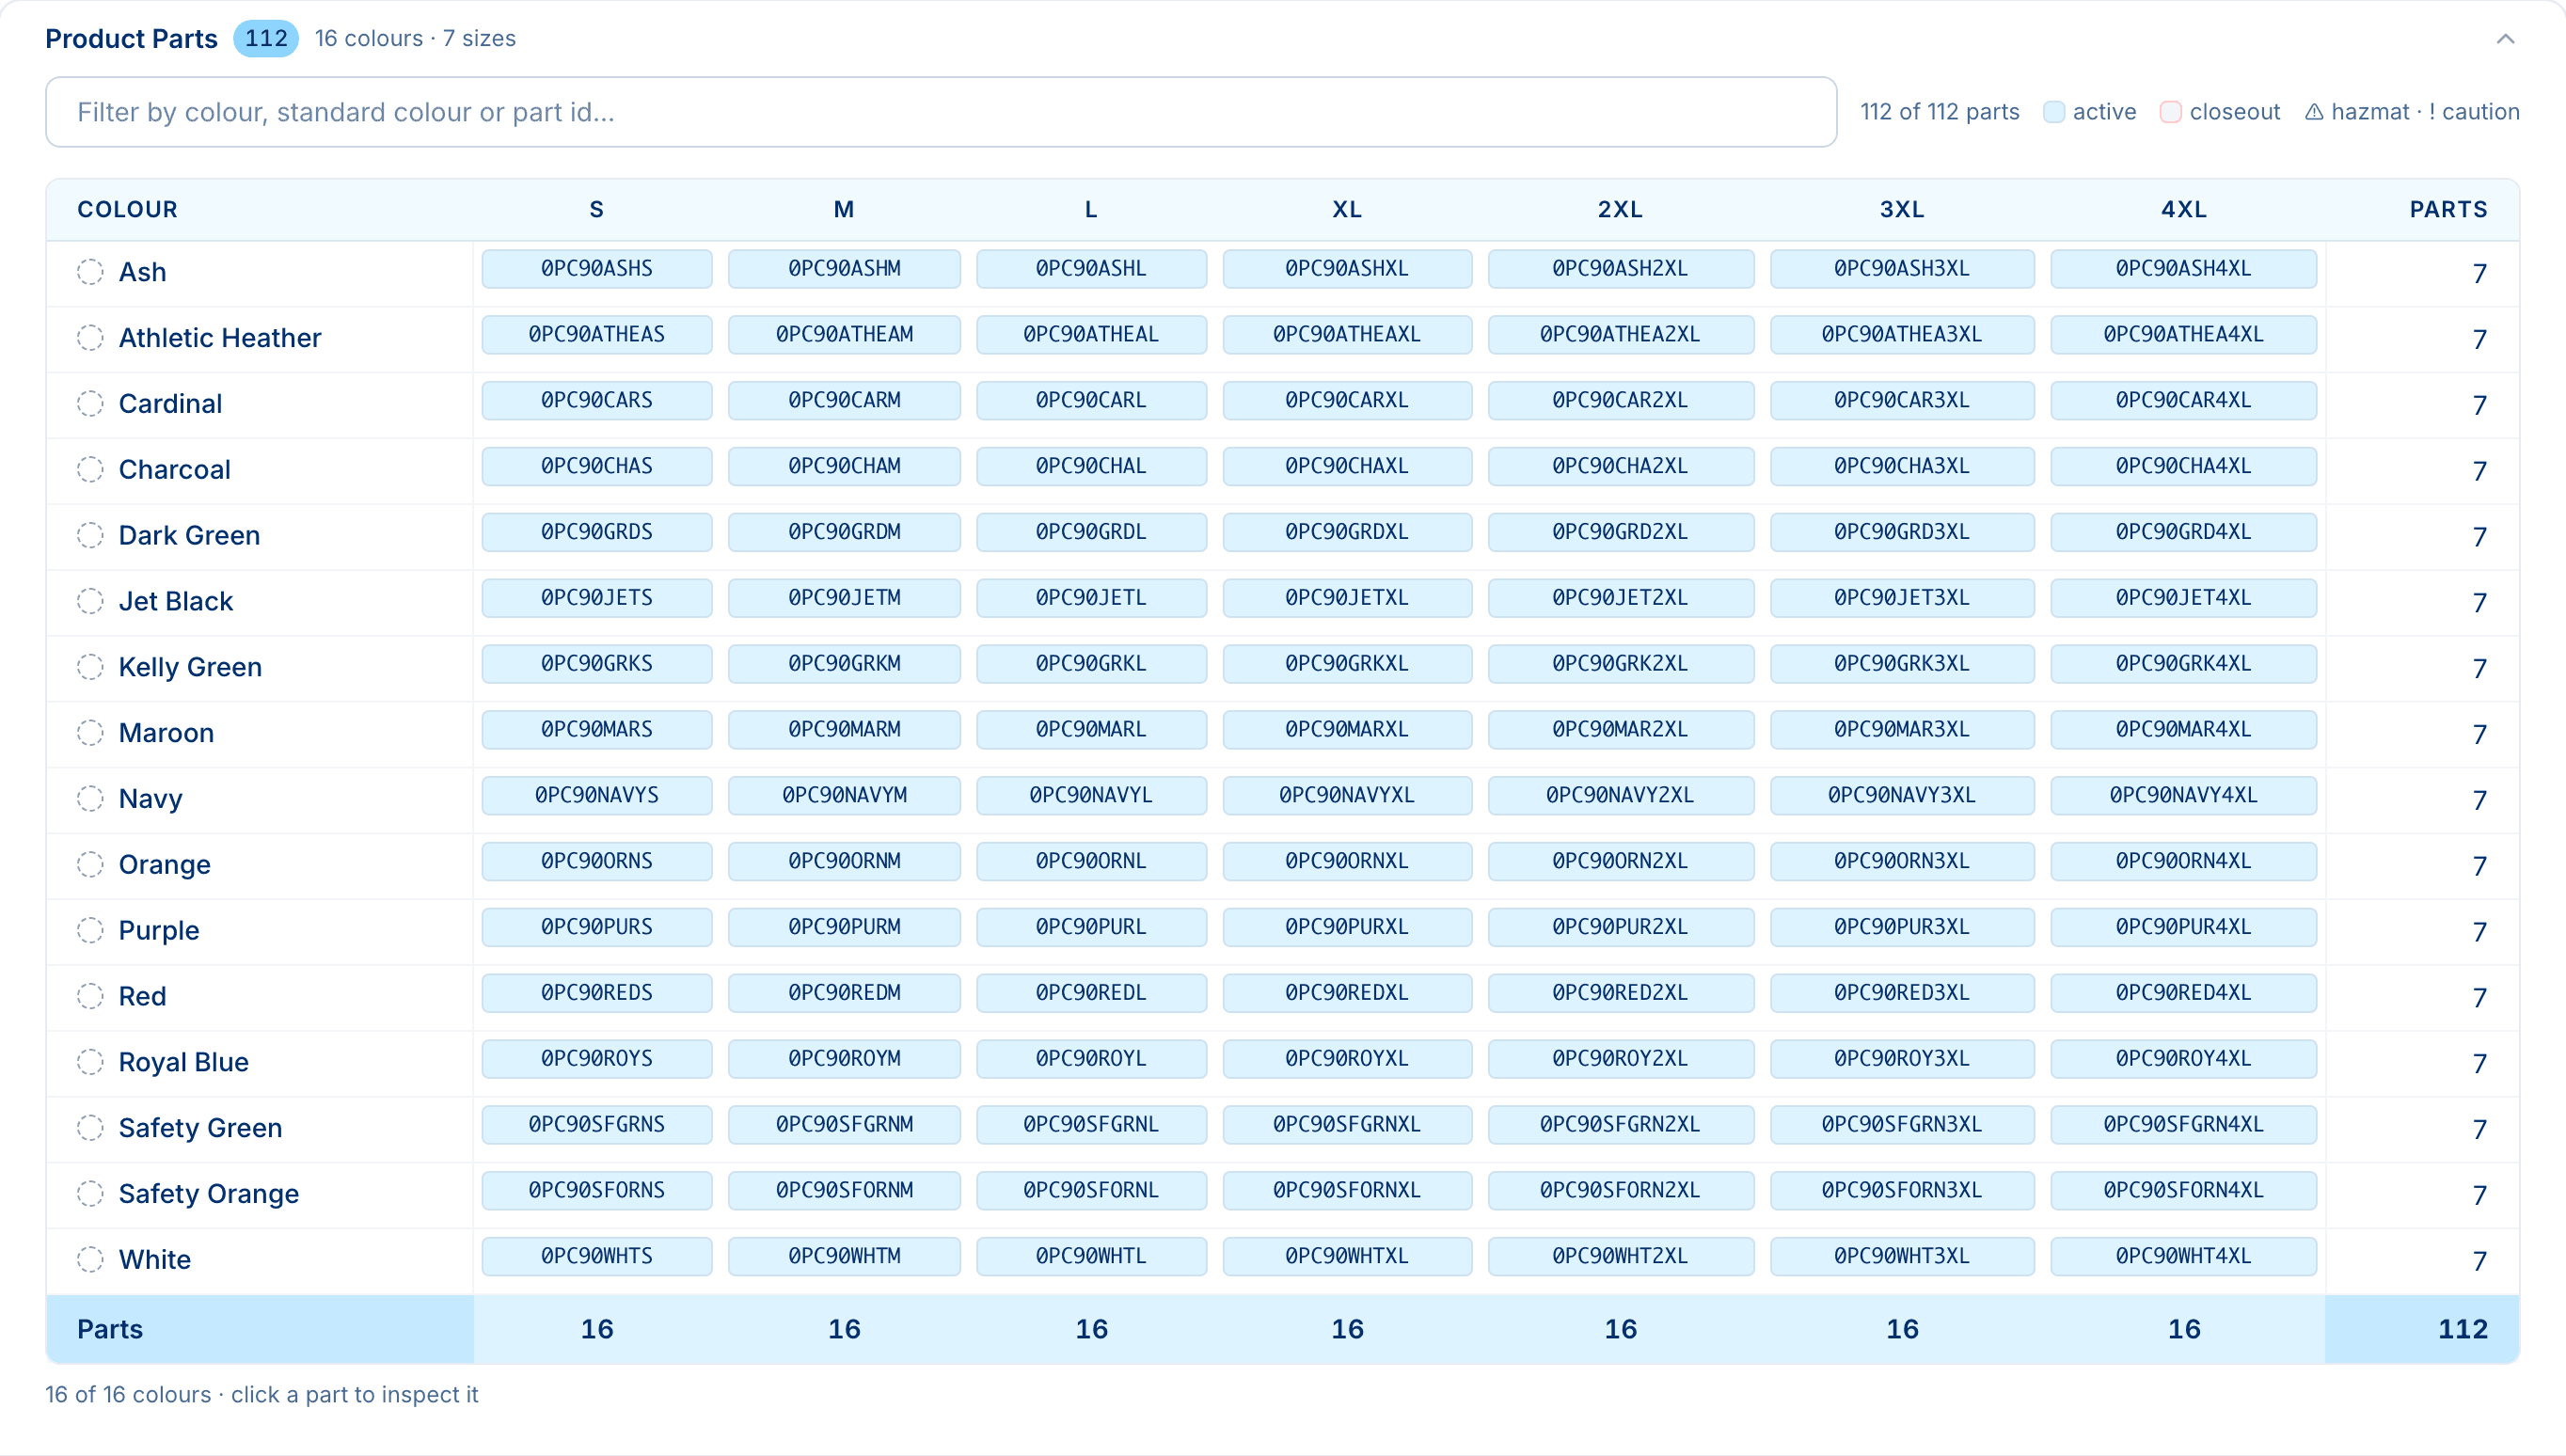
Apparel products are colours times sizes, so that is how the Product Data tab now shows them. HIT’s PC90 fleece crewneck is 16 colours across 7 sizes, and the matrix shows all 112 parts in one screen: one row per colour, one column per size, the part id in each cell. Colours are grouped by their display name, so a supplier that spells the same colour two ways per size still lands on one row. Products that are not apparel get a simple grouped list instead.
Search inside the product

Type in the filter box and the matrix narrows as you type. It matches the colour name, the supplier’s standard colour and the part id, so “heather”, “ATHEA” and “2XL” all work. The count beside the box always says how many parts are still in view.
Click a part to inspect it
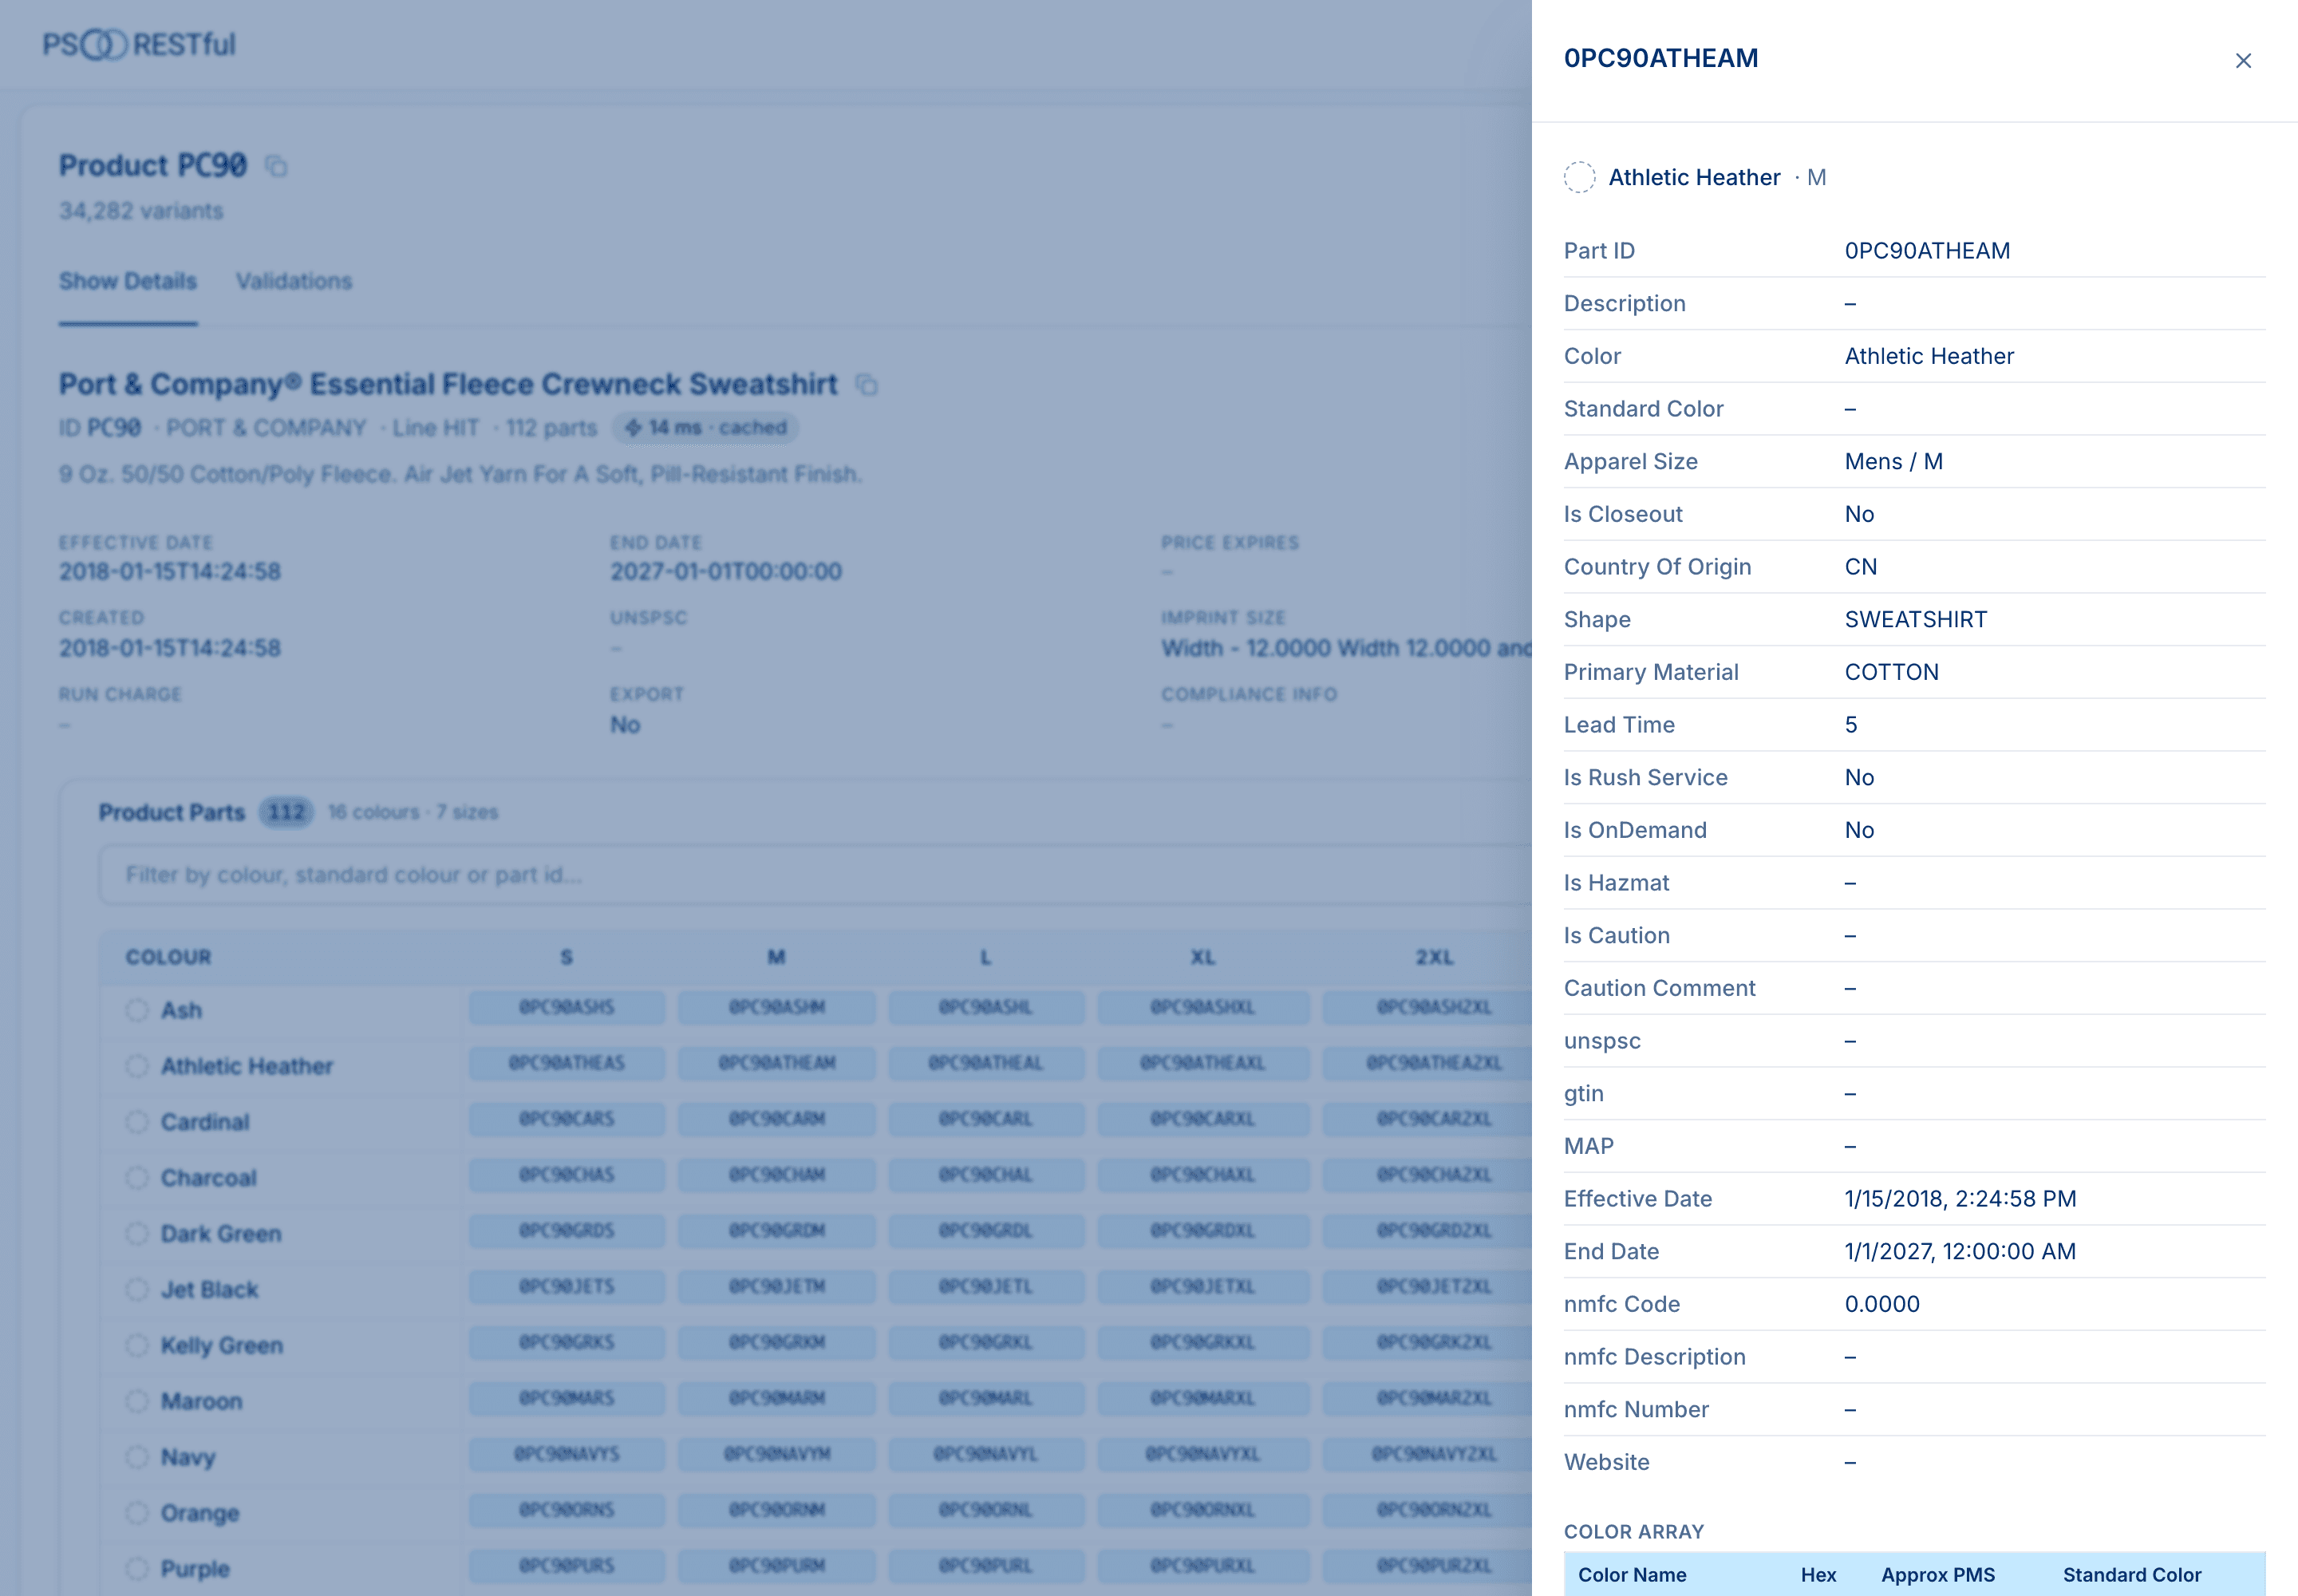
Every cell opens an inspector drawer with the whole part laid out as fields: description, apparel size, country of origin, lead time, closeout and hazmat flags, effective and end dates, then the colour array, shipping packages and the rest of the Product Data 2.0.0 record. A copy button gives you the raw JSON for that part when you need to paste it into a ticket. Product Data 1.0.0 suppliers get the same treatment with their own field set.
Inventory as a matrix too
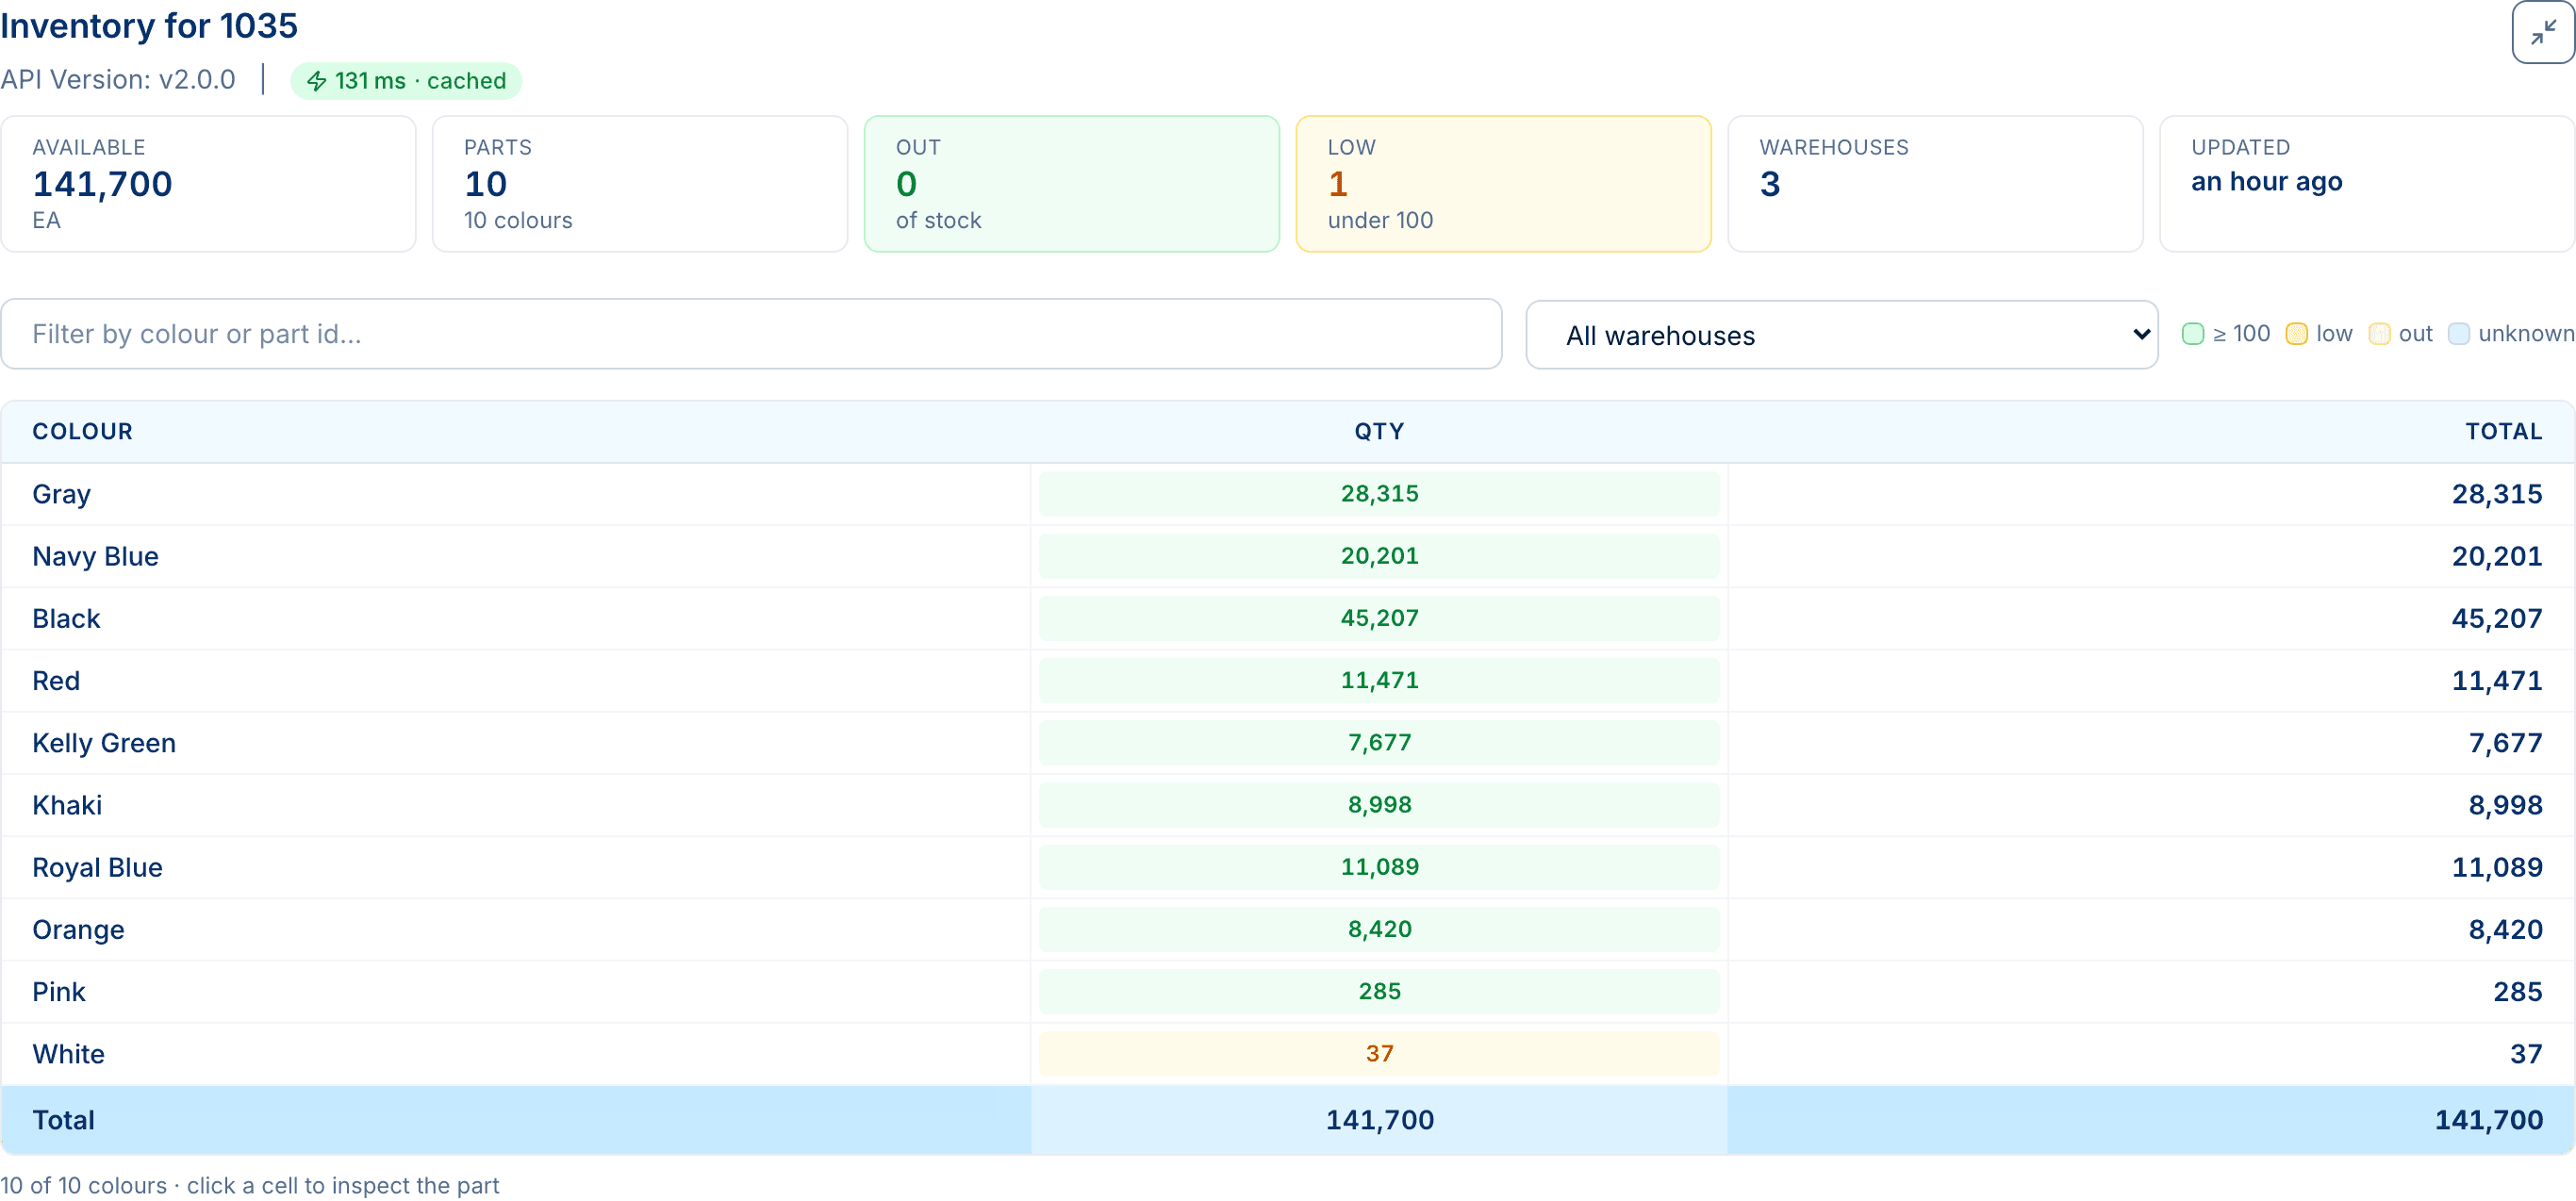
The Inventory tab uses the same grid, and it is the per-product counterpart of Stock Check , which looks across suppliers. Rows are colours, columns are sizes when the product has them, and each cell is coloured by stock level: green above 100, amber when it is running low, red when it is out, grey when the supplier did not say. The tiles above summarise the whole product: total available, parts and colours, how many are out or low, how many warehouses report, and when the supplier last updated. Pick a warehouse from the dropdown to see just its numbers, and click any cell to inspect that part’s locations and future availability. Inventory 2.0.0 and 1.2.1 both render the same way.
Media as a gallery, grouped by colour
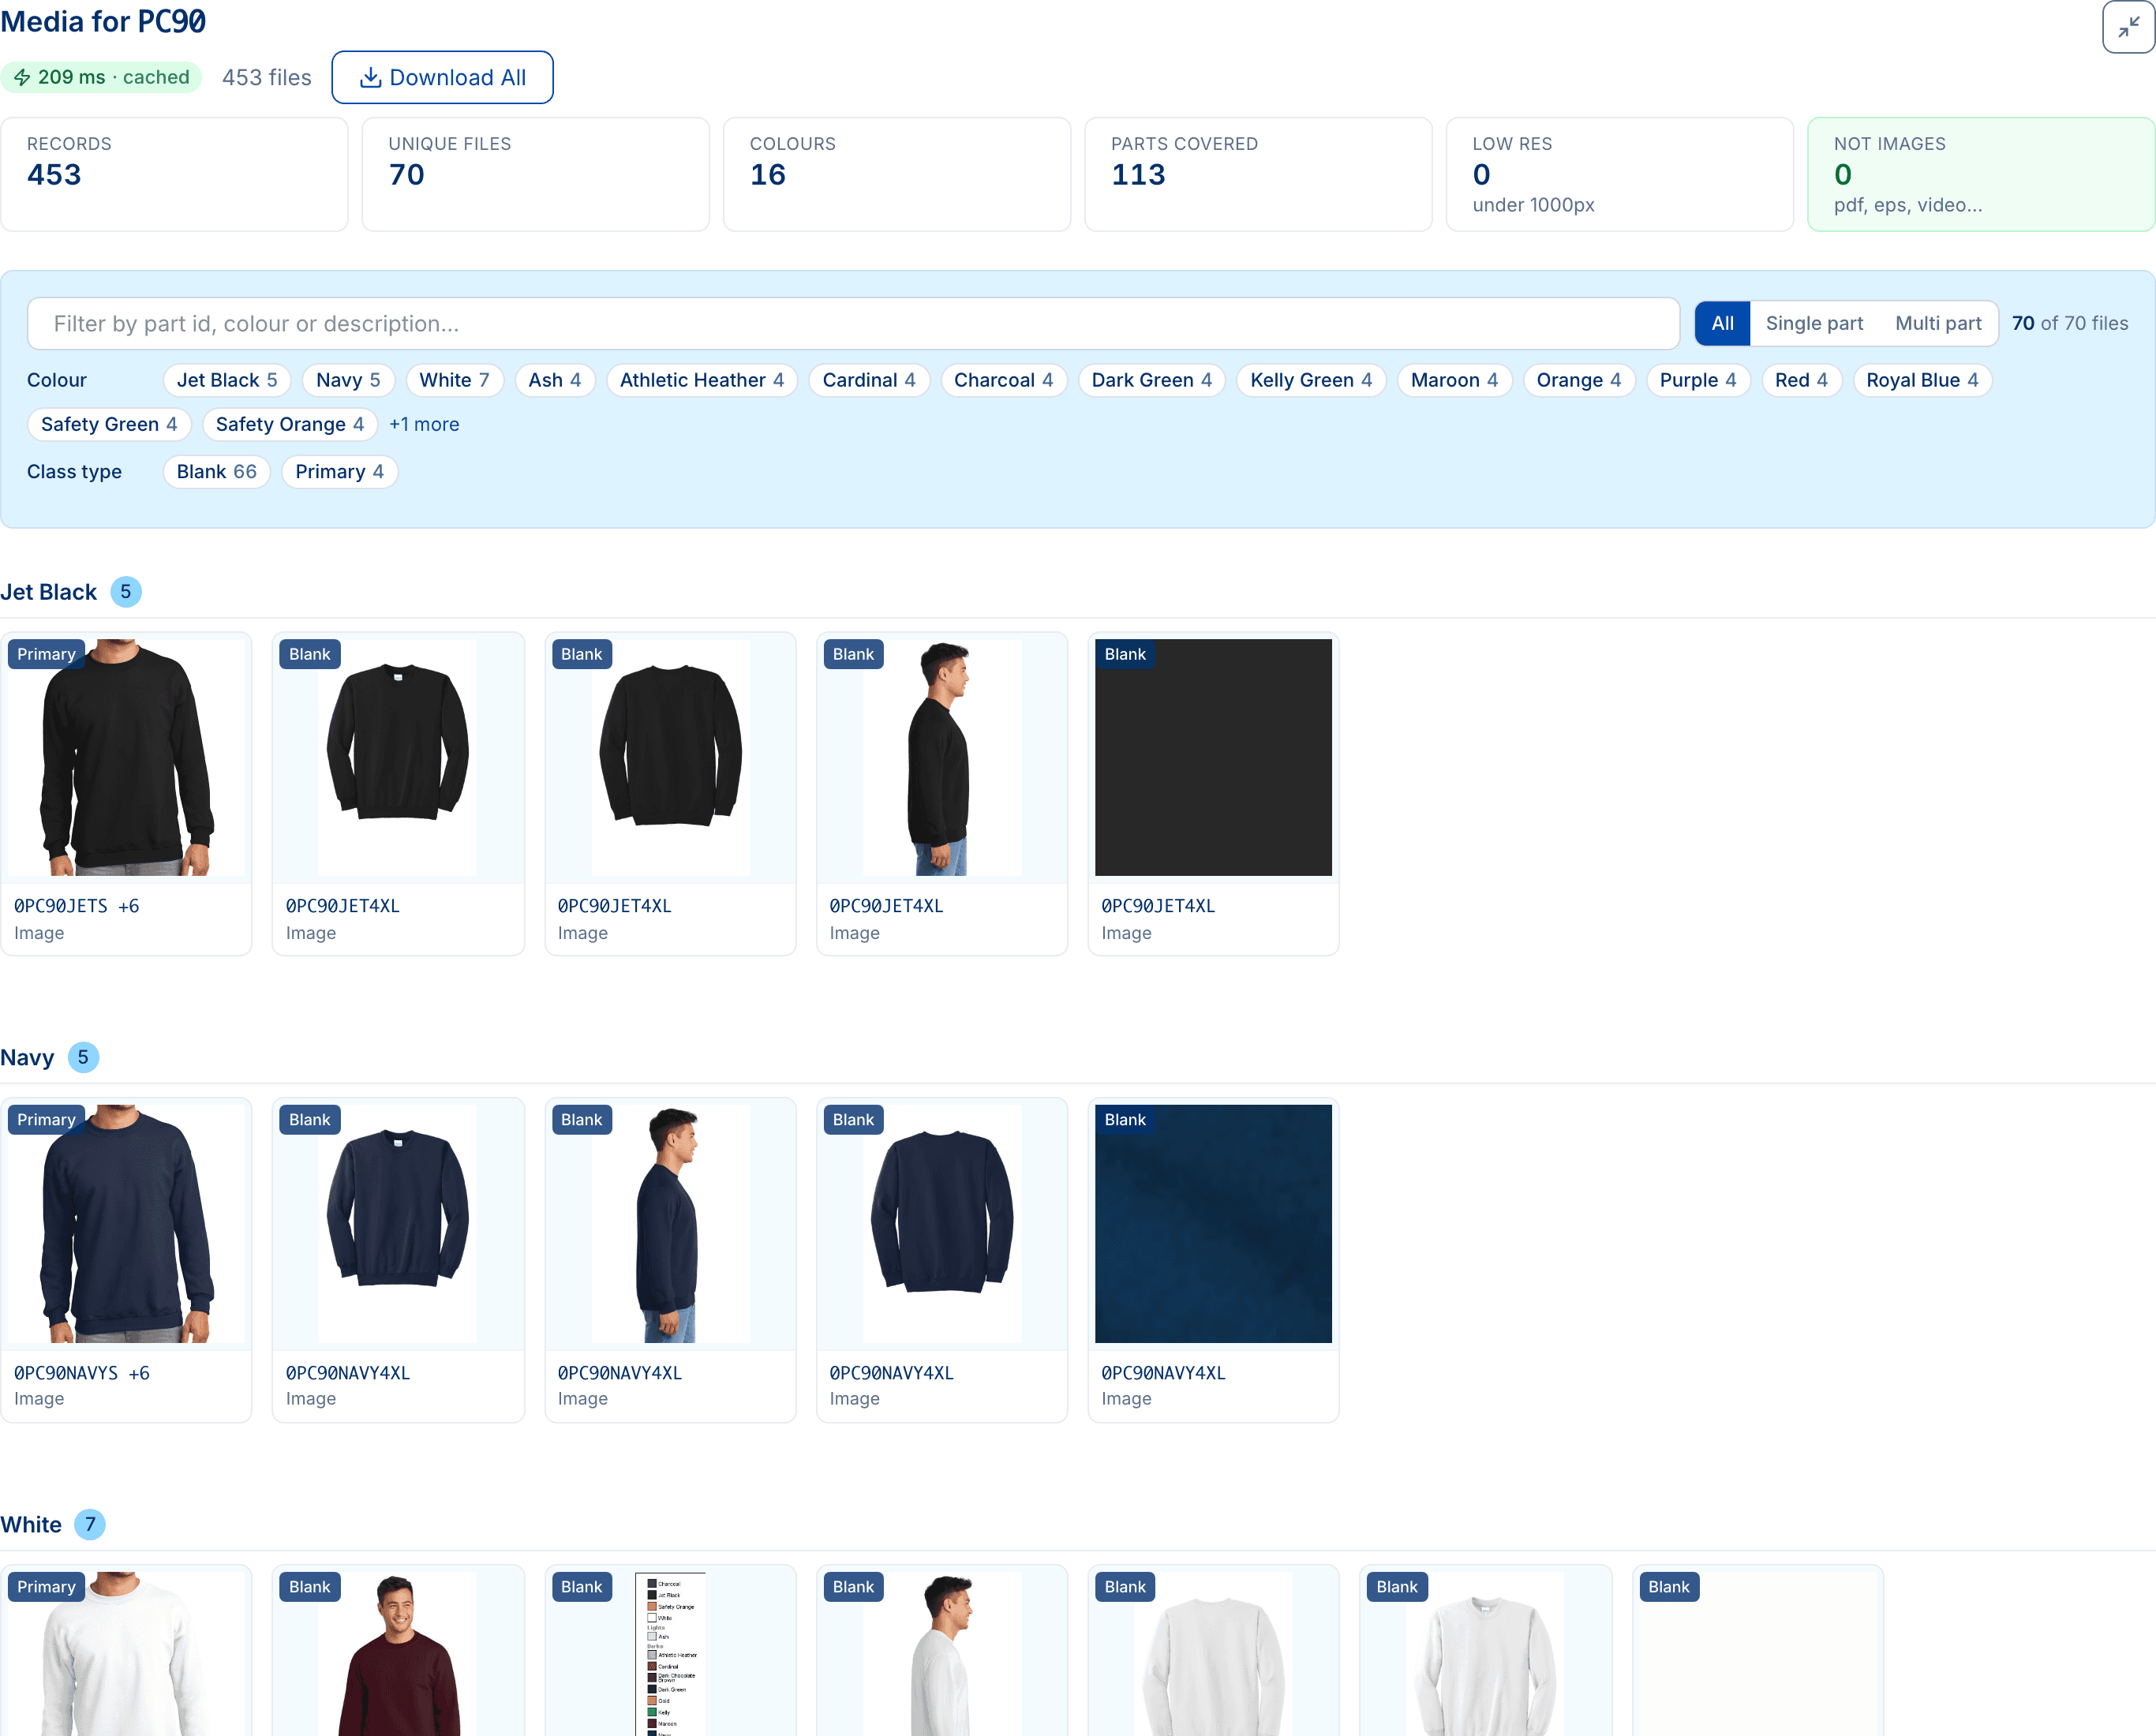
Media Content used to be a list of URLs. Now it is a gallery. The 453 media records HIT publishes for PC90 collapse to 70 unique files, grouped under the colour they belong to, with the class type on each card and the part ids it covers. Facet chips let you narrow to one colour or one class type, the toggle at the top splits single-part images from multi-part ones, and the search box matches part id, colour or description. The tiles flag what an integration cares about: how many files are under 1000 pixels, and how many are not images at all. Download All still gets you every file in one go.
Pricing & Configuration, in one place
This is the biggest change. The PPC tab was four sub-tabs, FOB points, charges, locations and pricing, and pricing came last behind a submit button. It is now one workspace with pricing first.
It runs on load. Open the tab and the panel asks the supplier for prices with sensible defaults: the first FOB point, Net prices, the Decorated configuration, all parts. Change anything in the form and it runs again.
The supplier’s tiers, as sent. The first thing you see is a table that mirrors the supplier’s PartPriceArray one to one: one row per minimum quantity with the price, the discount code, the effective and expiry dates, and how many parts carry that tier. When parts price a tier differently the row shows the range, and the matrix below shows each part. A Raw response toggle beside it shows and copies the entire answer.
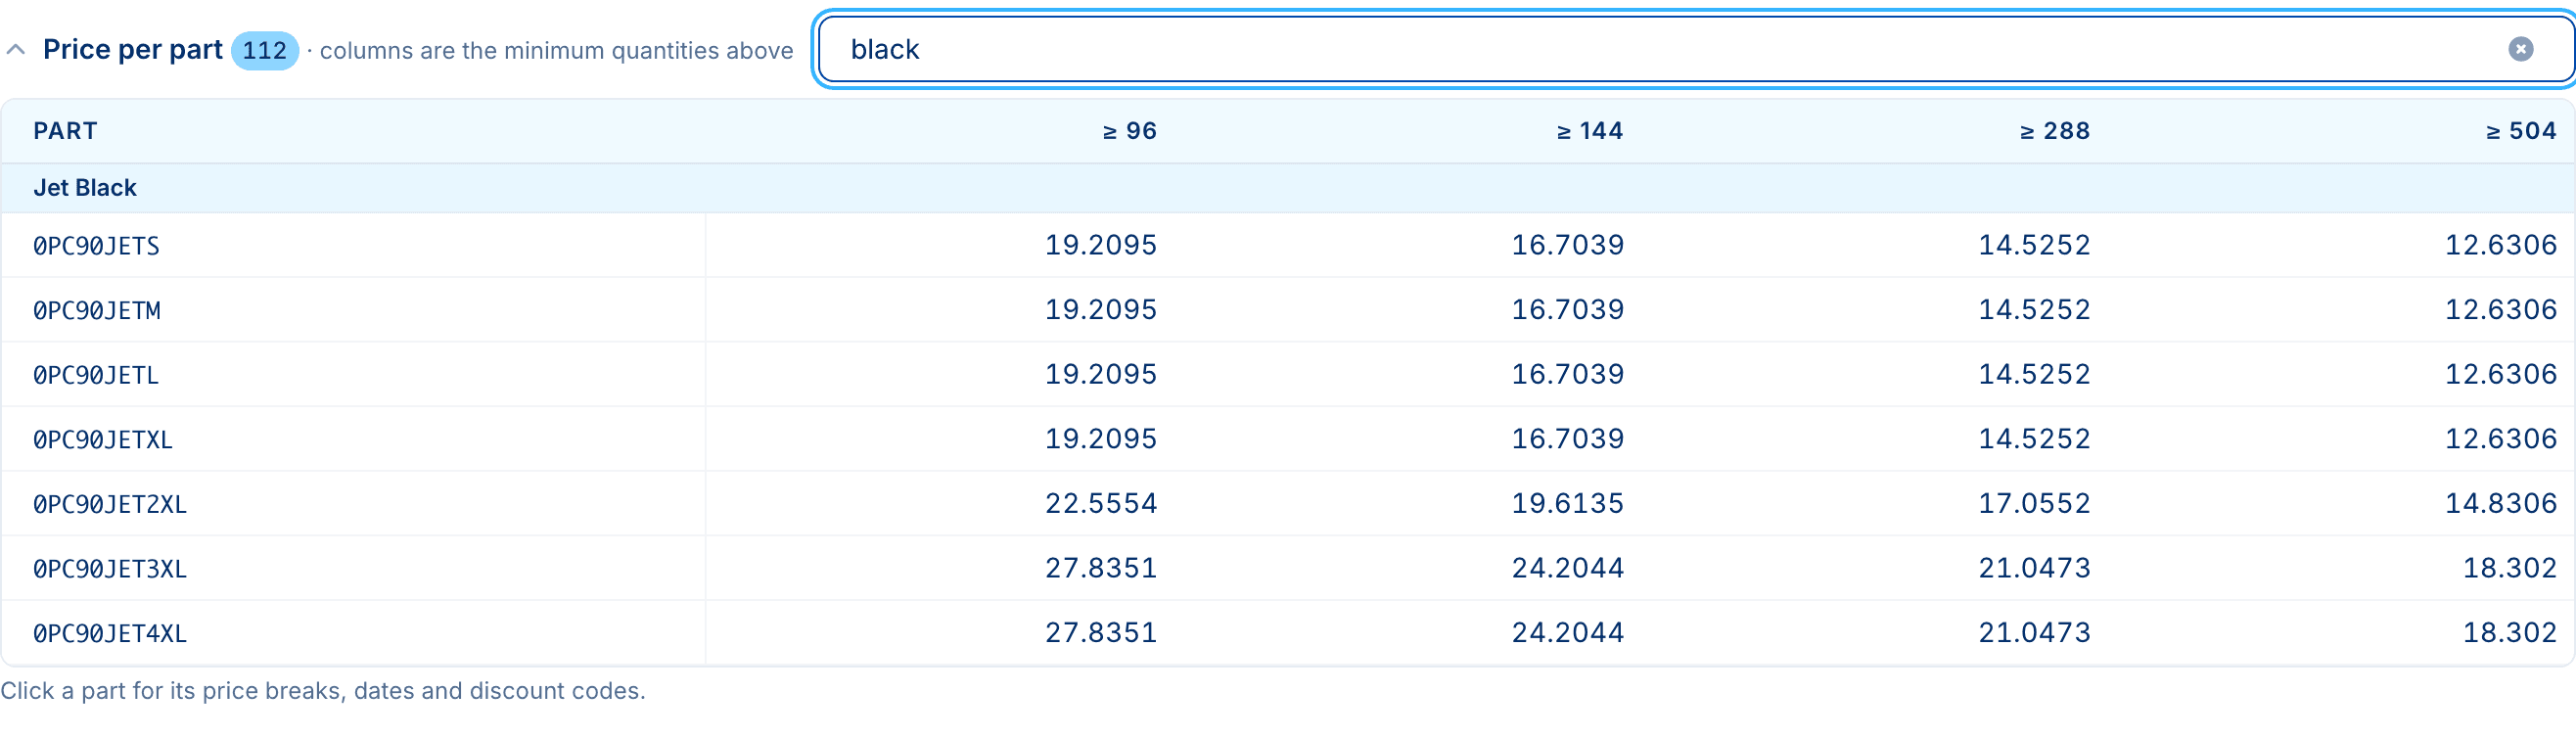
Price per part is the matrix: parts grouped by colour down the side, minimum quantities across the top. It has the same search box as the product matrix, so “black” leaves the seven Jet Black parts and their four breaks. Click a part for its full price list with dates and discount codes.
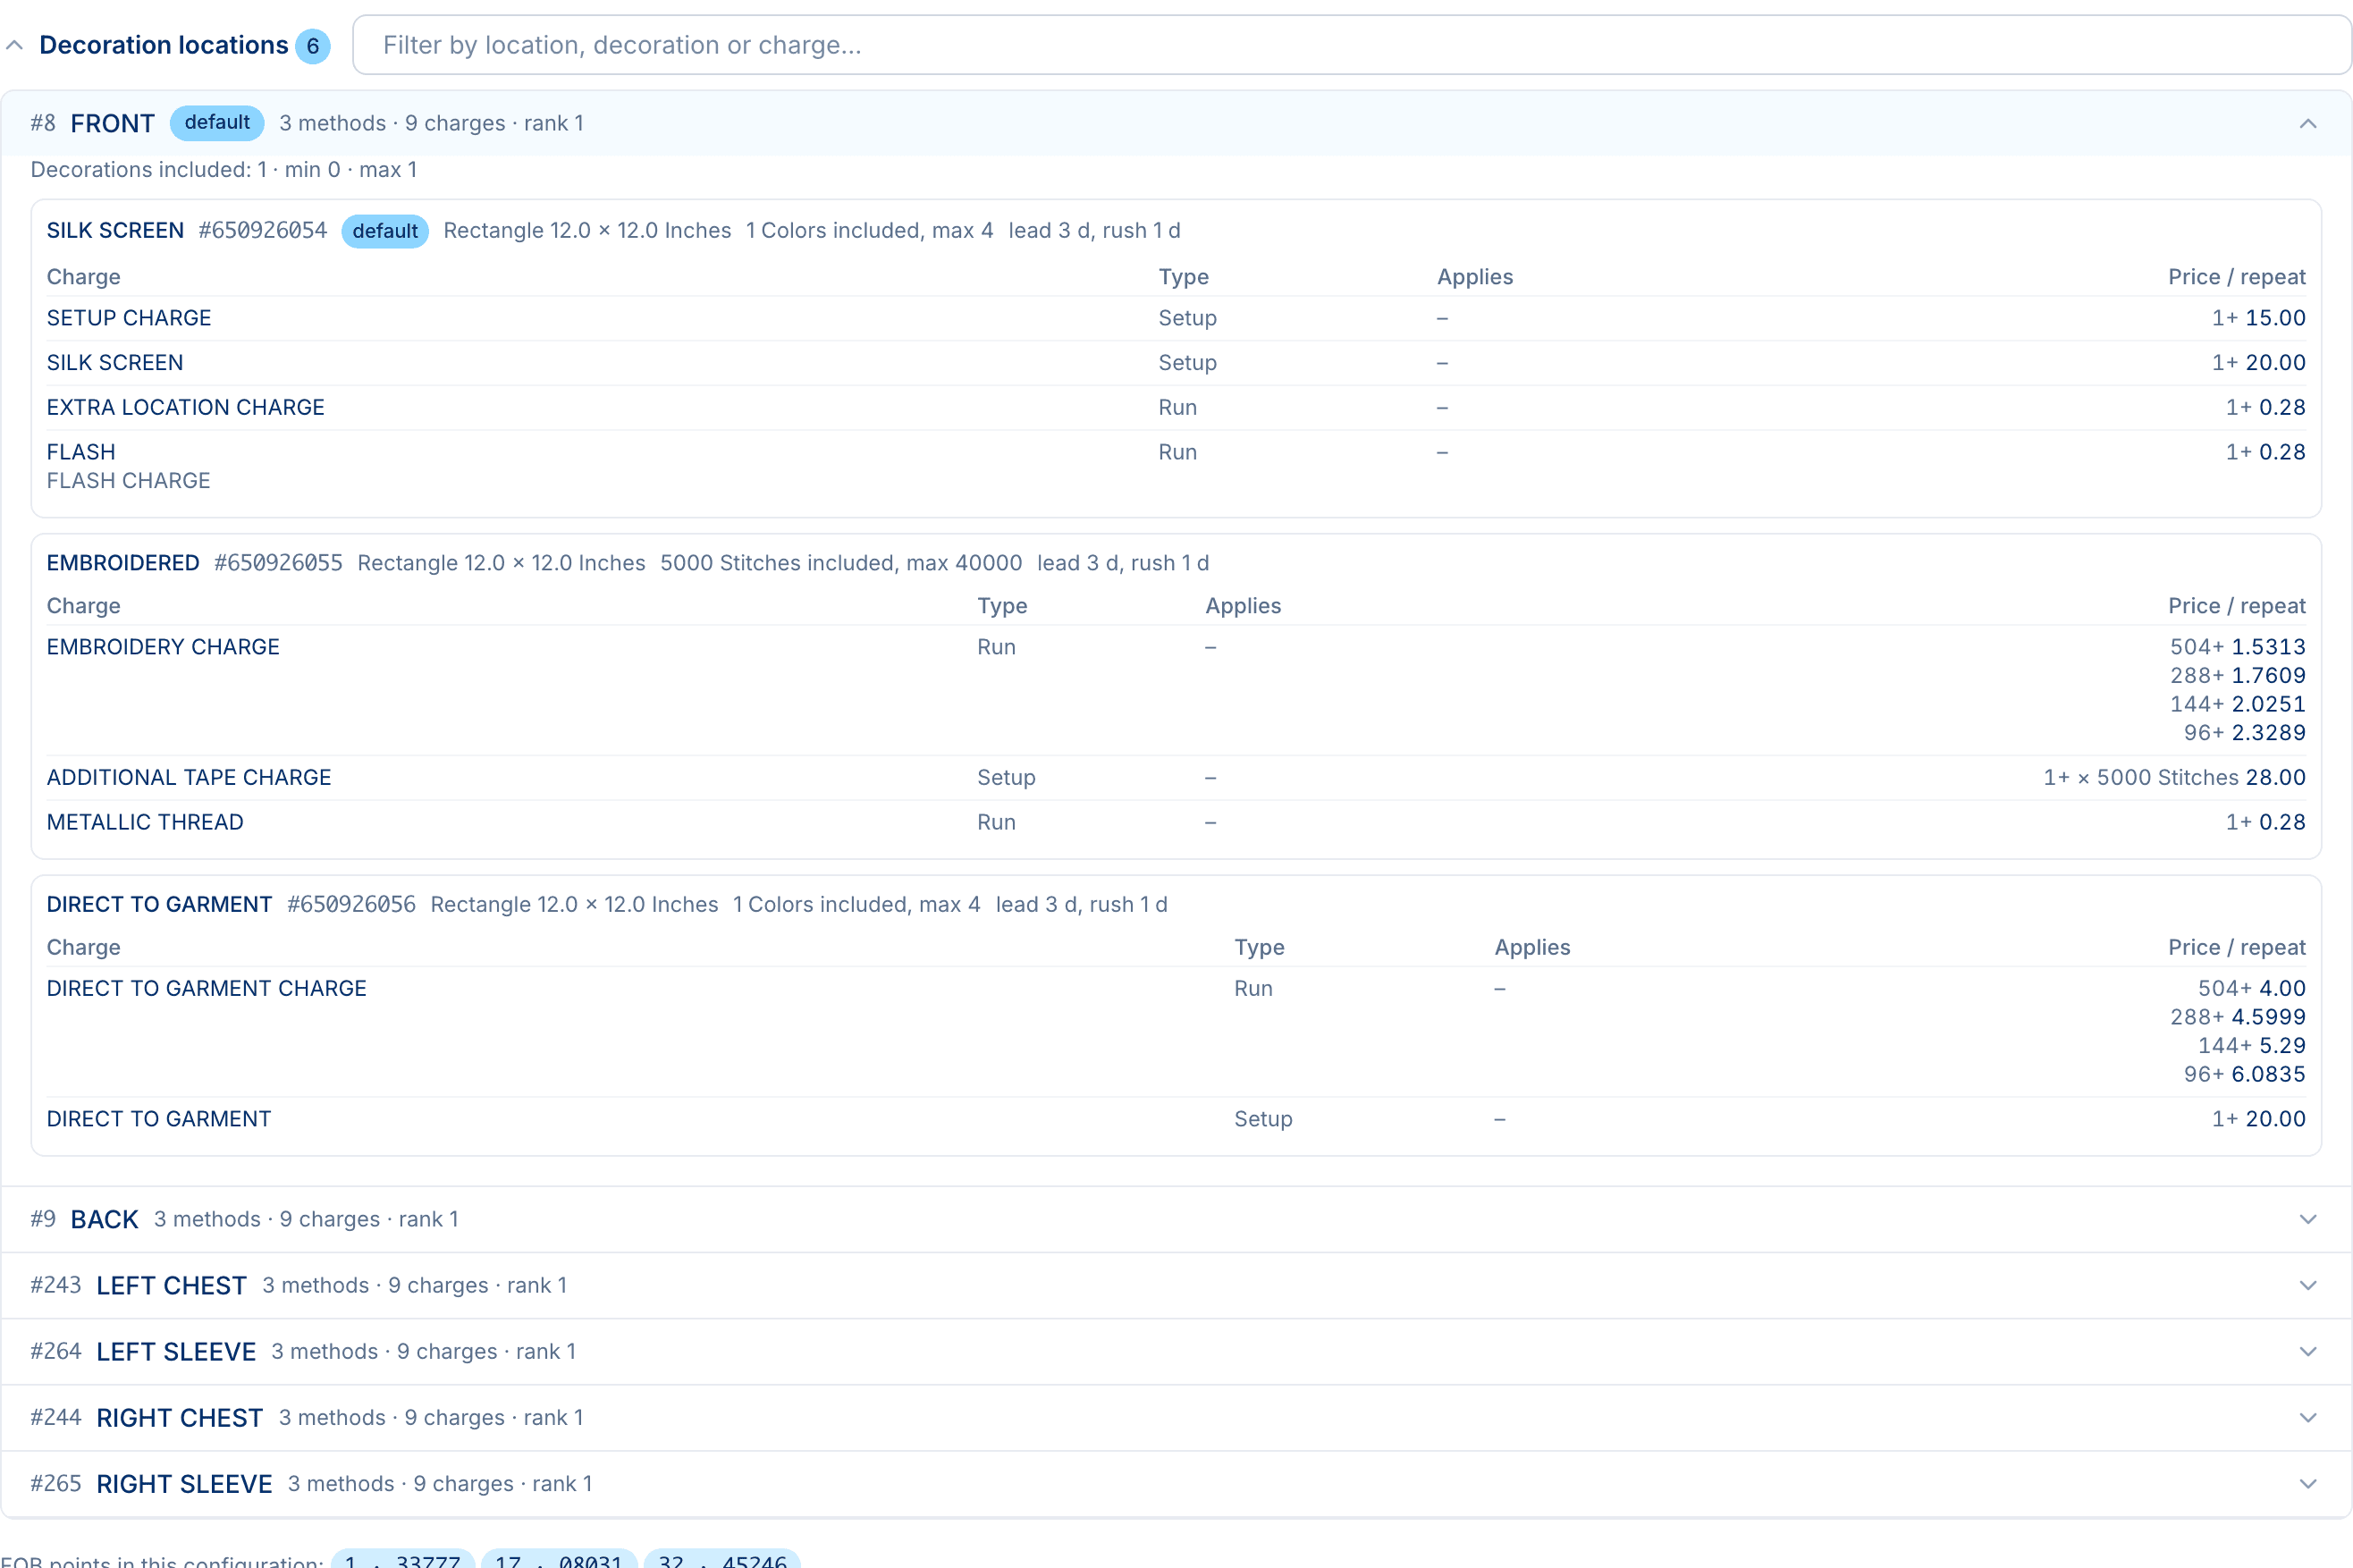
Decoration locations lists the locations that came back with the price, each one expanding to its methods with imprint area, units included, lead and rush times, and every charge with its price breaks inline. The filter matches the location, the method or the charge name, so typing “embroider” finds every location that offers it.
Long sections fold until you need them
Some products are simply big. A Gildan 5000 prices more than 500 parts, and some suppliers list 60 decoration locations on one product. Rendering all of that open pushed the sections below it off the screen.
So the two sections fold themselves when they are long: Price per part starts collapsed above 40 parts, Decoration locations above 12. The header keeps the count so you know what is there, one click opens it, and typing in the section’s filter opens it too, because if you are searching, you want to see the result. Small products stay fully open, so a one-part item looks exactly as it did.
The catalogue, searchable
Under the pricing result sit the supplier’s full FOB points, available charges and available locations for the product, each in its own section with its own timing badge. HIT lists 7,446 charges for PC90, so the charges table shows the first 500 and asks you to filter; the type chips narrow by Setup, Run and the rest. Locations with the same name are grouped with their ids as chips, and a location’s decoration colours load only when you open it, instead of forty requests on page load.
Products the supplier no longer lists
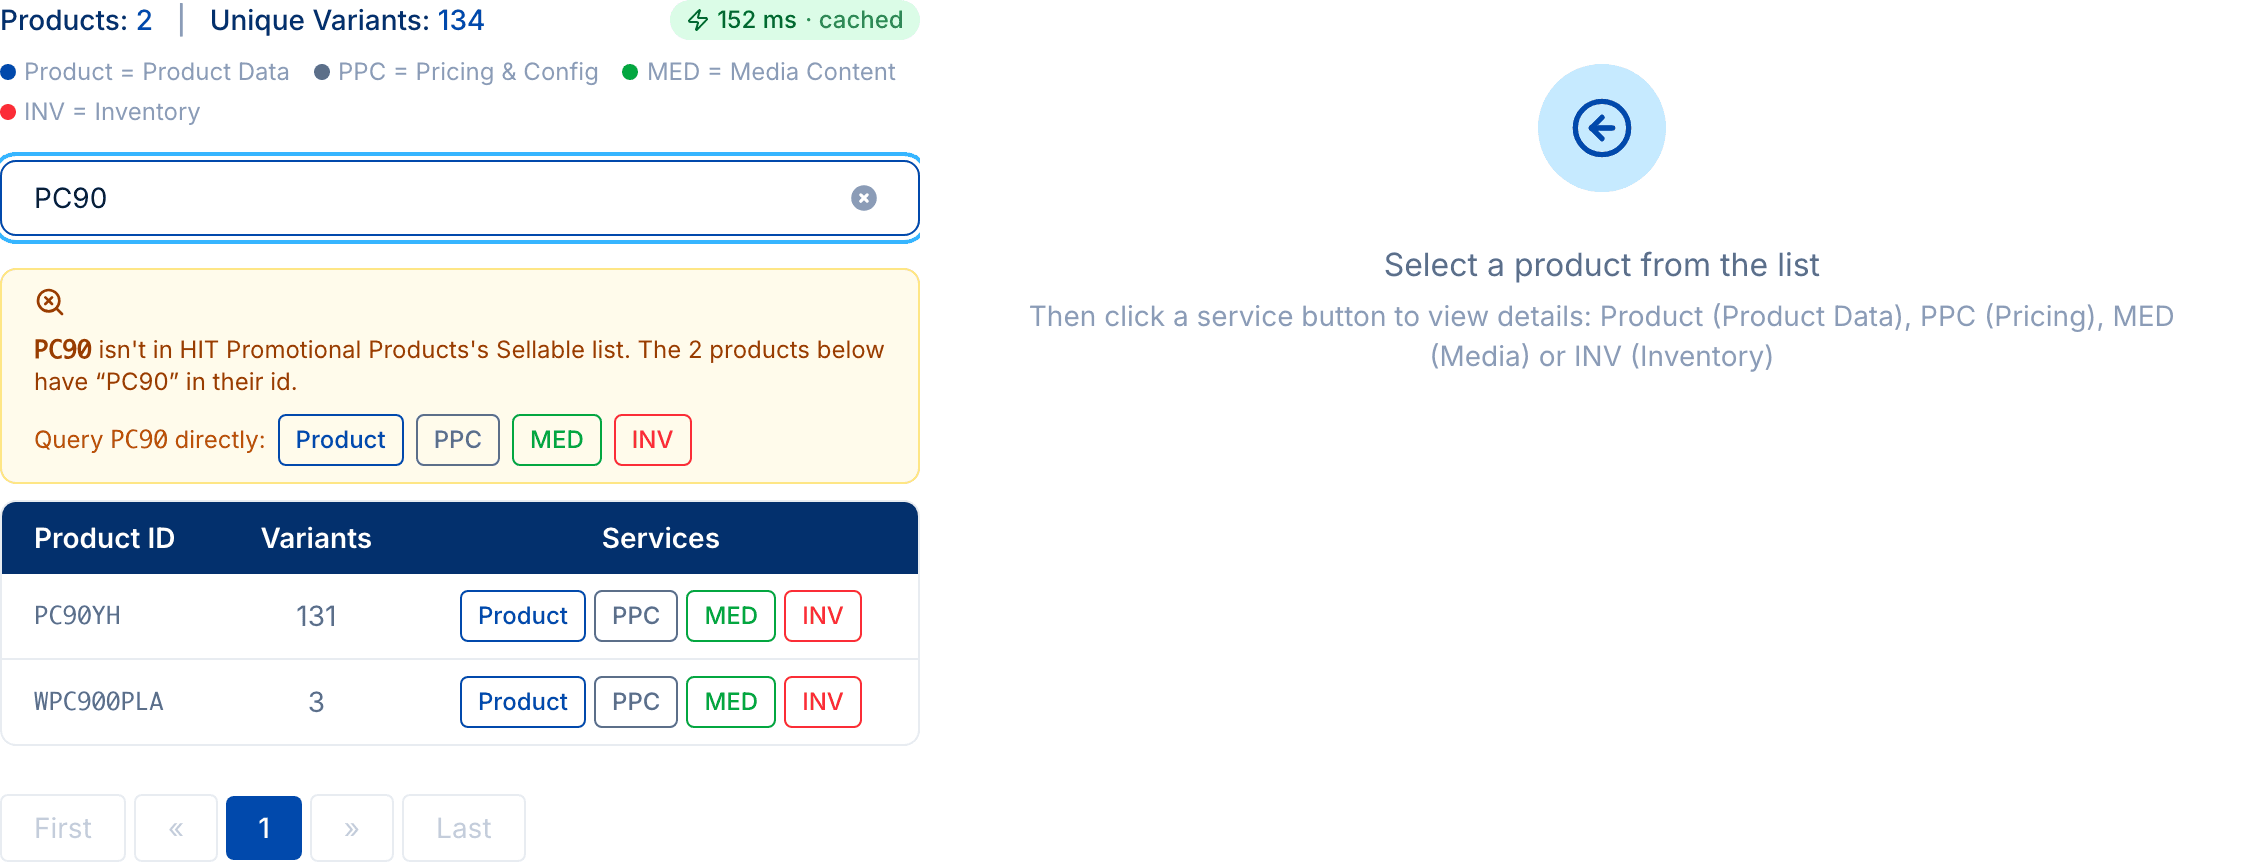
The product list on the left comes from the supplier’s published list for the data source you chose: sellable products, recently modified, or closeouts. But the raw services do not check that list. A discontinued product that dropped off the sellable feed will often still answer Product Data, Pricing, Media and Inventory calls, and sometimes that is exactly what you need to know: is the supplier still sending good data for it, or has it really gone?
So when the id you typed is not in the list, the explorer offers to query it directly. Search HIT for PC90 today and you get PC90YH and WPC900PLA, two ids that contain the text, but not PC90 itself. The strip above them says exactly that and gives you the four service buttons for PC90. They run the same calls as any listed product, straight against the supplier’s endpoints, without opening Postman and building the request by hand. For the SOAP endpoints themselves, the Web Service Validator remains the tool. When nothing matches at all, the same offer fills the empty list. Either way the wording is explicit: a response here does not make the product sellable, it only tells you what the endpoints return.
Honest about what the supplier said
A few smaller things that matter when you are debugging:
- Empty is not an error. A supplier answering “No Results Found” gets an amber “lists nothing here” state, and real supplier errors are red. Both say when the answer came from the cache and that Bypass asks again.
- Requests that drift. Some suppliers answer a Net request with a Customer configuration, or price in their own currency. The badge on the result reports what came back, and a note says what you asked for, so it never looks like the form was ignored.
- Credentials, not silence. SanMar gives no PPC or inventory data unless your account carries your own SanMar credentials . Instead of rendering zero FOB points and zero charges, the explorer now says exactly that, with links to add your credentials or request them from the supplier.
Try it
The new Data Explorer is live for every PSRESTful account. Open Dashboard, then Data Explorer , pick a supplier, and click Product, PPC, MED or INV beside any product. The Data Explorer guide walks through each tab.
If you are not on PSRESTful yet, the free plan includes the Data Explorer, and signing up takes a minute. As always, feedback goes to our contact form .